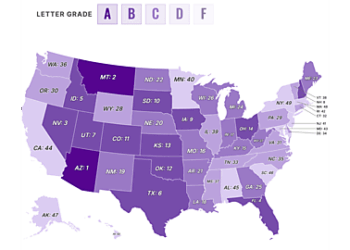

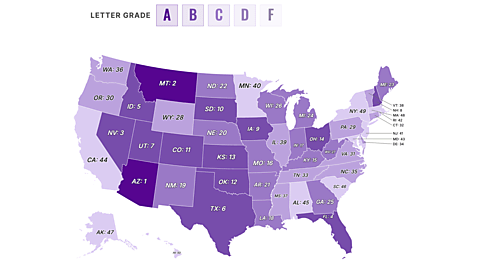

Today the Cato Institute released the “Freedom in the 50 States” report for 2026.
This revamped index consists of 97 policy measures over 10 categories sorted into either economic freedom or personal freedom. It assigns scores and letter grades to US states based on this general combined level of freedom. And, for the first time in the report’s history, this edition also scores and grades governors on how well or poorly they have advanced both economic and personal liberty in their states.
You can see the results here. And you can take a deep dive into the scores using the Data Dashboard and interactive maps. There’s plenty to see and analyze for yourself.
The project was over a year in the making. And when you spend that much time on a project, you usually accumulate plenty of insights. So you’ll be seeing more analysis from me based on the data in the index for Cato’s blog, in future policy reports, and elsewhere.
But, for now, here are a few observations to help contextualize the new “Freedom in the 50 States”:
Not a single state scored better than 76 percent in almost any category (except for Firearm Freedom, eight states did score 100 percent in that). You don’t need to have kids to know that these students could use some improvement. In almost all categories, the states that received A grades did so because they were comparatively better than the others, not because they were perfect.
All policy measures are equally weighted in this index because all freedoms are equally important. That also means that a restriction in, say, Firearm Freedom can be offset by an increase in freedom in another category. That’s actually one of the values of creating a broad measure that includes both economic and personal freedom. The overall aggregate amount of pro-freedom policies is being measured and helps us gain a sense of the tendency toward or away from freedom in a state. (On that subject, recall my prior observation that no state has a perfect score in virtually any of the categories.)
The governor scores might also be best thought of as gauging the direction they are taking their state. If the status quo of a state is already generally pro-liberty and a governor hasn’t done anything to change or damage that, they will receive the same score as the state. But if a governor is pushing reforms that make the state freer on net—and especially if they are the reason the state is in good shape—they will receive a higher score than the state. Vice versa for the governors who tried or were successful at eliminating pro-freedom policies.
You might see a high-scoring governor or state that enacted a policy you think was not in line with the principles of freedom. You might think their scores are too high as a result. But what “Freedom in the 50 States” measures is policies that are actually in force. Thankfully, many of the enacted policies that are anti-liberty have been overturned by a court, so they don’t count against a state. However, they usually count against the governor who proposed the policies.