


On March 17, 2026, the Department of Homeland Security issued the broadest and longest waiver of the Jones Act since 1950, temporarily suspending the law’s domestic shipping restrictions for vessels transporting 659 types of energy products and fertilizers. Originally set to last 60 days, the waiver was later extended and is now scheduled to expire on August 16.
The waiver offers an interesting public policy experiment, providing a glimpse of how domestic shipping responds when the law’s restrictions are no longer applied and raising intriguing questions. What kinds of cargo are moving, and on which routes? Which ports and which states have seen the most activity? Has it displaced existing vessels operating under the Jones Act or created new and increased volumes of domestic commerce that otherwise wouldn’t take place?
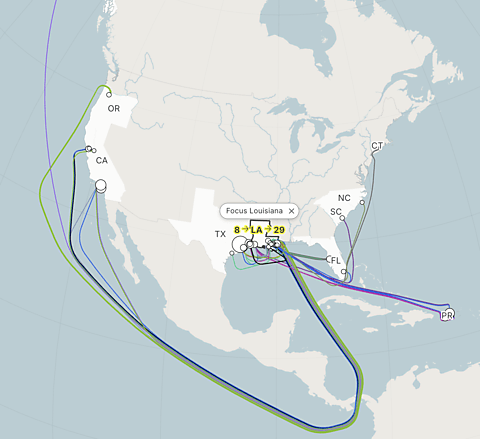
To provide answers, the Cato Institute has built the Jones Act Waiver Tracker, an interactive, first-of-its-kind dashboard that draws directly on the voyage reports that waiver users must file with the Maritime Administration (MARAD). The tracker incorporates MARAD’s latest data, allowing anyone to follow the waiver as it unfolds rather than relying on static snapshots or anecdotal evidence.
This allows the waiver to be explored in several different ways.
Want to see where cargoes are moving? Every waiver voyage appears on an interactive route map, color-coded by product type. Clicking on a voyage reveals additional details, including the vessel, cargo, quantity transported, and ports involved.
Curious which ports have handled the most waiver traffic? Click on any port or state to view its imports, exports, and associated voyages. Ports’ bubble sizes scale with traffic volume, making major hubs immediately apparent.
Looking for a particular shipment? The sortable shipment table lets users filter voyages by loading date, discharge date, cargo type, vessel, and other characteristics.
At the top of the dashboard, running counters provide an up-to-date summary of key metrics, including completed voyages, unique vessels used, cargo volumes, cargo categories, and Panama Canal transits.
Interested in broader trends? Interactive charts compare waiver-period movements with historical domestic shipping patterns dating back to 2015, showing whether current flows are above or below what historical trends would predict.
What the Data Already Show
As of July 10, 2026 — 115 days into the waiver — the tracker shows:
162 voyages completed
135 unique vessels involved
38 voyages transiting the Panama Canal
16 distinct cargo categories moved
Nearly 40 million barrels shipped (39,955,137)
Gasoline (42 voyages, 11.1 million barrels) and crude oil (25 voyages, 10.9 million barrels) account for the bulk of cargo by volume, but the waiver has also facilitated shipments of diesel, jet fuel, naphtha, renewable fuels, propane, asphalt, fertilizers, and numerous other products.
The Gulf Coast — the country’s leading refining and oil export hub — dominates as an origin point, with Texas accounting for 69 export voyages and Louisiana another 25. California is the top importer, with 36 cargoes arriving in the state from elsewhere in the country, while Puerto Rico has received 19 waiver voyages and Florida, which lacks pipeline connections to domestic refineries, features 12.
What the Baseline and Historical Comparisons Reveal
Perhaps the most striking part of the tracker is its charts showing what happens when waiver-period shipments are measured against each region’s historical trend:
West Coast/Alaska/Hawaii (PADD 5): 10.7 million barrels have arrived, an 83 percent addition to the region’s projected annual baseline. The product mix is also telling. While shipments to the West Coast have historically been dominated by a single product (renewable diesel), waiver cargo has been far more diverse, spanning gasoline, crude oil, and jet fuel. In fact, more jet fuel has been shipped to the West Coast from other PADDs under the waiver than in the last 36 years combined.
Puerto Rico: 3.63 million barrels delivered, which is 97 percent above the annualized baseline and on pace to exceed any prior full-year total. Propane particularly stands out. Roughly 49 percent more propane has moved from the mainland to Puerto Rico under the waiver than was shipped in total between 2004 and 2025.
New England (PADD 1A): The largest percentage increase of any region at 172 percent above its modest projected baseline. New England, which lacks refineries, has taken delivery of 997,000 barrels over 115 days, almost entirely gasoline and diesel.
Central Atlantic (PADD 1B): An 8.35-million-barrel, 27 percent addition on top of normal flows, dominated by crude oil originating in Texas. That pattern comports with a 2017 admission from a Jones Act tanker company executive that, absent the law, more crude would move from Texas to the East Coast.
Gulf Coast (PADD 3) and Lower Atlantic (PADD 1C): Smaller in absolute terms at 1.21 million and 2.29 million barrels, respectively, but both are still running above their projected baselines (roughly +400 percent and +0.8 percent).
Across all measured regions, waiver-period shipments have equaled or exceeded the historical trend. That pattern is consistent with a simple explanation: there is a meaningful amount of domestic shipping demand that the Jones Act-compliant fleet has been unable to meet, either due to insufficient vessel supply or prohibitively high costs.
The Waiver Is Adding Capacity, Not Displacing It
A common objection to the waiver is that foreign-flagged vessels are simply taking business away from Jones Act-compliant ships. The available evidence suggests otherwise.
A separate tracker monitoring all 56 Jones Act-compliant tankers has shown that every one of them has been fully employed since it was set up in late May. That matters for interpreting the waiver’s numbers. If the Jones Act tanker fleet is already fully utilized, the waiver cannot displace idle domestic capacity, only supplement it. The cargo moving under the waiver, therefore, appears to reflect transportation demand that exceeded the existing fleet’s capacity.
The case is even stronger for certain cargoes because the necessary self-propelled, oceangoing ship types used in their transportation simply do not exist in the Jones Act fleet. All three propane voyages were carried aboard LPG tankers, a vessel type entirely absent from the fleet. All three asphalt/bitumen voyages used asphalt carriers, another vessel type absent from the fleet. Three additional voyages transporting petroleum coke or fertilizer used dry bulk carriers, equally absent from the fleet, while another fertilizer shipment required a tanker of a size not represented in the Jones Act fleet.
In other words, the waiver appears to expand domestic maritime transportation in two distinct ways. First, it supplements a Jones Act tanker fleet that is already fully employed. Second, it enables movements requiring specialized, oceangoing vessel types that are absent from the Jones Act fleet altogether. In neither case is there evidence that foreign-flagged vessels are displacing idle US-flag ships.
An Evolving Picture
The Jones Act waiver remains in effect through August 16, and MARAD continues to publish new voyage reports on a rolling basis. As those reports appear, the Jones Act Waiver Tracker will continue to update automatically, providing journalists, policymakers, researchers, and the public with the most comprehensive picture available of how the waiver is being used.
We invite readers to explore the data themselves. The debate over the Jones Act is often driven by assertions about what would or would not happen if its restrictions were relaxed. This tracker offers something more valuable: the opportunity to examine what is actually taking place.